
Building Embedded C Applications on Windows with GCC, CMake and Ninja
Most embedded C developers start writing their code on their microcontroller manufacturer's provided IDE - STM32CubeIDE, MPLAB X, TI Code Composer, NXP MCUXpresso, Segger Embedded Studio, Keil uVision, etc. The debugger support, peripheral setup tools and project structure support make this the right way to go, but at some point you should realise that these are not the best editors on the market and waiting for chip programming times makes your debugging cycle is slow.
Why build embedded applications on Windows with VS Code?
Although the manufacturer's IDE can be very capable, leveraging the power of Eclipse or NetBeans, there are many features of other editors like Visual Studio Code which make it preferable once your work moves away from the hardware-specific or register level debugging phases. VS Code is so much more customisable with themes, extendable with the extension marketplace and powerful with multi-pane, multi-window editing, as well as being frequently updated that it is not really comparable to what the chip manufacturers' can offer.
I've spent many development hours working in VS Code, using as an editor, saving the files then alt-tabbing over to the manufacturer's IDE to build, program, run, debug and step through. I know that this process is perfectly usable but it would be better if you could stay inside VS Code while building to at least get the compiler errors and warnings eliminated before attempting to program a chip, whilst staying in the fully-featured environment.
In the hobbyist, open-source or non-profit world, it makes sense to install Visual Studio Community Edition with its integrated MSVC compiler. But the licencing costs are high for many small businesses and you might not want your only compiler to be MSVC for any number of reasons. If your company has adopted CI/CD, the builds will be happening on the build server, which would need its own licence. Or the build server might not be running Windows. Most of the time, you'd want to stick with the same compiler vendor (GCC) as used by your micro so that you don't get completely different behaviour in some edge cases. However, if you want a standalone MSVC compiler without Visual Studio, PortableBuildTools has you covered.
Windows dominates the corporate computing world so most developers get a Windows machine for all their office work - Teams, Outlook, Word, Excel, Powerpoint, Sharepoint etc for which there are huge numbers of MS certified support technicians. But the world of C programming has UNIX roots and many of today's best C tools are Linux based, so developers constantly face the problems of getting these tools to run on Windows. This was the major challenge I faced with trying to get setup with the tools described in this post and the following one on unit testing, and it was tempting to "give up" in a sense, install WSL and start working within an Ubuntu command line environment.
However, I persisted with the non-WSL route because I believe that WSL is seen as such a big hurdle that it puts many embedded developers off going any further. Learn a whole operating system, and copy files back and forth, just to do some compiles, and run some unit tests? It's enough to put you off installing GCC or unit test frameworks like CppUTest because they close the page as soon as they see this sort of message:
supports Debian and Ubuntu - use apt-get, Red Hat - use yum, MacOSX - use brew, also runs on FreeBSD and Solaris, or you can build from source.
which you'll find on many a useful C tool's install page, download page, GitHub setup or readme page or community support page.
Whilst there are ways of running unit tests which aren't dependent on GCC, such as MSTest and Minunit, the most popular unit test frameworks like googletest, CppUTest and Ceedling expect various Linux-world utilities to be available - Make, Bash, Ruby, autotools, binutils, etc. So getting GCC running on Windows is a first step into solving that problem.
But my manufacturer's IDE already includes GCC, why do I need another installation?
Your manufacturer's IDE version of GCC will be configured to build for your embedded target processor, not your Windows processor, libraries and IO. There are lots of differences between hosted and freestanding implementations of C, but a significant one we need is getting standard input and output (console) so that printf works. Another is that we want to connect to gdb that VS Code uses to debug.
Common solutions are heavyweight
The usual methods to get Linuxy tools installed on Windows involve Cygwin, MinGW, MSYS2 or WSL + Ubuntu. I'm sure its a major reason why adoption of TDD amongst embedded developers has always lagged behind the rest of the software world, where TDD tooling is often just a part of the language, framework or environment. When we get to CppUTest, we find that James Grenning suggests Cygwin and then says "The install may take a couple hours"😠.
Microsoft's page on GCC with MinGW uses MSYS2 and although helpful, uses C++ for the first project which might put C programmers off, and has more steps than this method.
VMs are always another option, if your IT environment allows them - from experience some corporates don't, for security excuses reasons. You are immediately faced with another set of choices - Hyper-V on Windows 11 Pro, VMWare, VirtualBox, QEMU, or 65 other alternatives, where you've now got to learn the hypervisor system, download say a 5 GB Linux iso, and start installing your tools and code onto a scratch machine.
It's very easy to see why an embedded developer or their manager would say
this is all too time-consuming and unnecessary, let's just manually run a few tests which also proves out the whole chain of software and hardware, forget host-based building and testing, just do target-based builds and tests.
While that's fine for once, and is of course a good idea as a final step before a release, but if it's not automated then it's not going to be done often enough to catch bugs early.
So what I was looking for was a self-contained installable GCC-plus-tools to be able to get C projects (not just individual files) building, running on Windows in the sense of command-line or no UI, not GUIs, with debug support - breakpoints, stepping, variable evaluations. The solution described below is now my preferred method of setting this up and allows CppUTest to be added later.
Build Systems
If you've lived your embedded development life inside manufacturer's IDEs, then you might not be aware of what their integrated build system is doing for you, and assume that building is the same as compiling. When we open the build console in STM32CubeIDE, for example, we see that it issues this command
make -j8 all
which means the make utility is being called to run up to 8 compiles in parallel for the entire project, using the rules defined in a Makefile which Cube has written for you. If you want to see what one looks like, the project/Debug/ or project/Release folder has one. Each of the subdirectories can have their own makefile (*.mk).
Makefiles are difficult to work with and the modern method is to use CMake instead which has an easier, higher level syntax and is cross-platform, handles paths, link flags and preprocessor definitions, and can call make or others like Ninja to coordinate the actual build. We want all of these tool chains to end in calling GCC to compile and link a final exe.
Installing TDM-GCC for VS code
The TDM-GCC package is an easy installer for GCC and the tools we need on Windows. Download it and run the installer.
Click Create. You have to choose the 64 bit option because the 32 bit option attempts to download from http://osdn.net which is now offline.
Choose type of install as TDM-GCC Recommended, C/C++, leave all the components selection as default, click Install.
64-bit installs 507MB. When it completes, you have a TDM-GCC-64 folder.
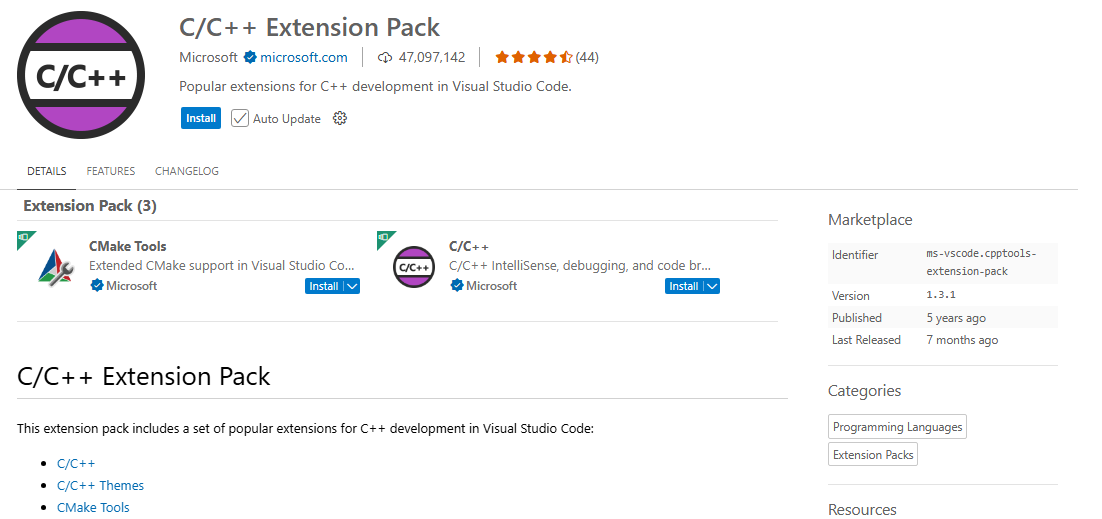
When you open a project with C files in VS Code, it offers to install C/C++ extension Pack by Microsoft which you should do. If you miss the chance, find it in the extension sidebar and install it. Note that this doesn't include a C/C++ compiler or CMake, but it does include compiler support.
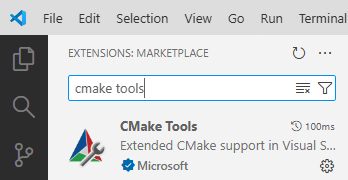
Install CMake Tools Extension
Install the CMake Tools extension for VS Code from Microsoft.
Install and use CMake
Download and install CMake.
When installing, ensure "Add CMake to the PATH environment variable" is checked.
CMake processes the files called CMakeLists.txt in the project and sets up the build system, I will be using Ninja to do the build coordination. Close VS Code while installing CMake and Ninja (below) and don't open it until you've installed both.
You'll find instructions online that say install the CMake VS Code extension by "twxs" but there is no need for that.
Install and use Ninja
Download Ninja and unzip it, put the single exe that it contains in the CMake\bin folder because it can be found with the PATH variable that the CMake install already set up without having to add another folder. If you installed CMake with default settings, it will be in C:\Program Files\CMake
CMake Getting Started Project
For many years, my knowledge of the C ecosystem of tools was held back by not even wanting to look at anything labelled C++ since it wasn't a language I'd had any education in or was applicable to the deeply embedded firmware I worked on because of lack of compiler and/or processor support. Once I found the embedded firmware online community, I realised that there is a lot of material out there that can be very helpful, it's just not as well publicised as the Big Tech world of web and mobile technologies. If you pick carefully, there's some fantastic material of interest to the pure C programmer in ACCU Conferences, CppOnSea, CppCon, NDC, and Better Software Conference to name a few that I've found.
The best tutorial video on CMake that I found was from Jason Turner, which I recommend watching even for non-C++ programmers. Unfortunately the repo he shows in that video has since been changed and migrated, but I tracked down a copy of the original and converted it for C code.
Clone or download my cmake-getting-started-c project from GitHub and open it with VS Code. Since this is a getting started project, I've used the shortcut method of global recurse to include all the .c files in the folder to prevent you from getting stuck if you renamed or added c files to the project, but this isn't considered best practice.
When scan for kits comes up, choose GCC 10.3.0 x86_64-w64-mingw32
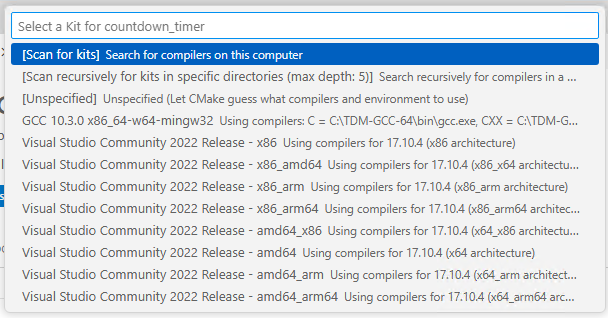
or if you missed the opportunity to select this because some other dialog popped up first, use CMake Tools sidebar, Configure - [No Kit Selected] Pencil icon, then choose the kit.
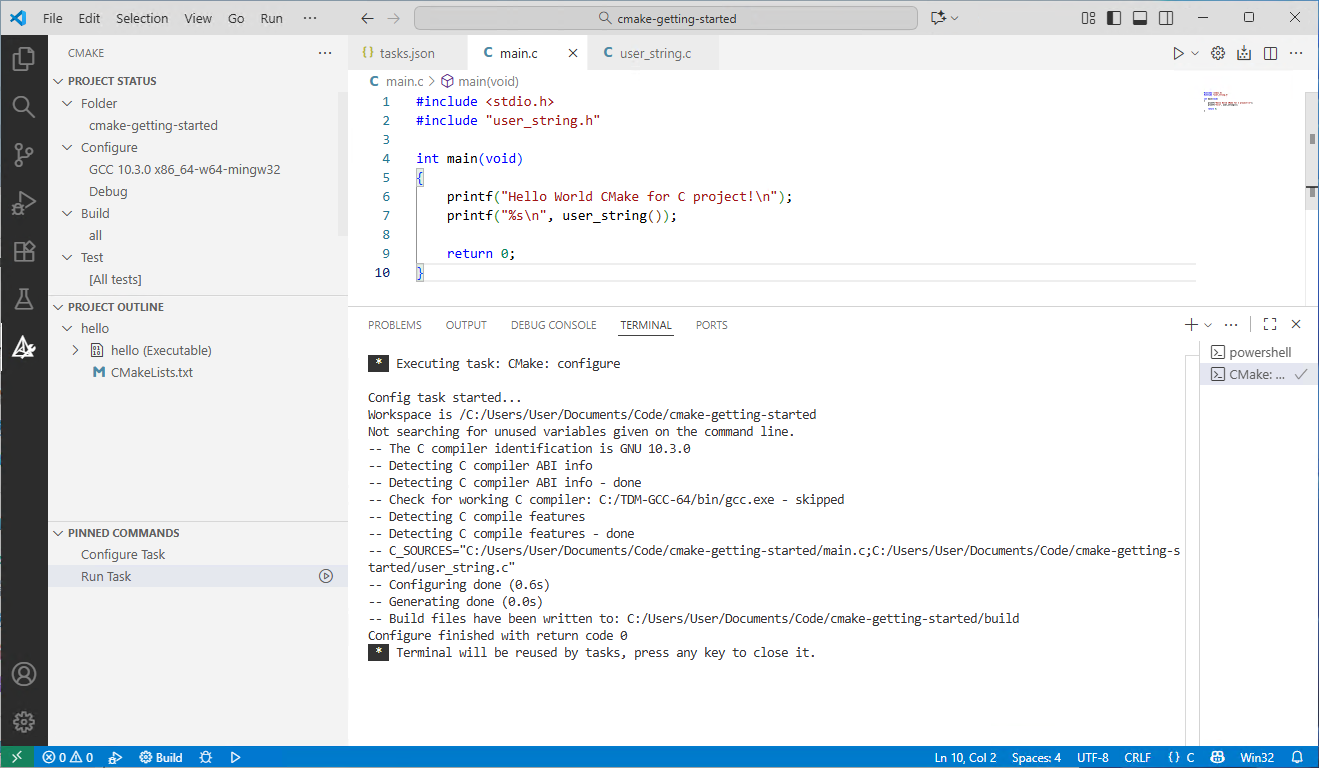
In CMake Tools sidebar, Pinned Commands - Run Task - Play icon - Cmake:configure
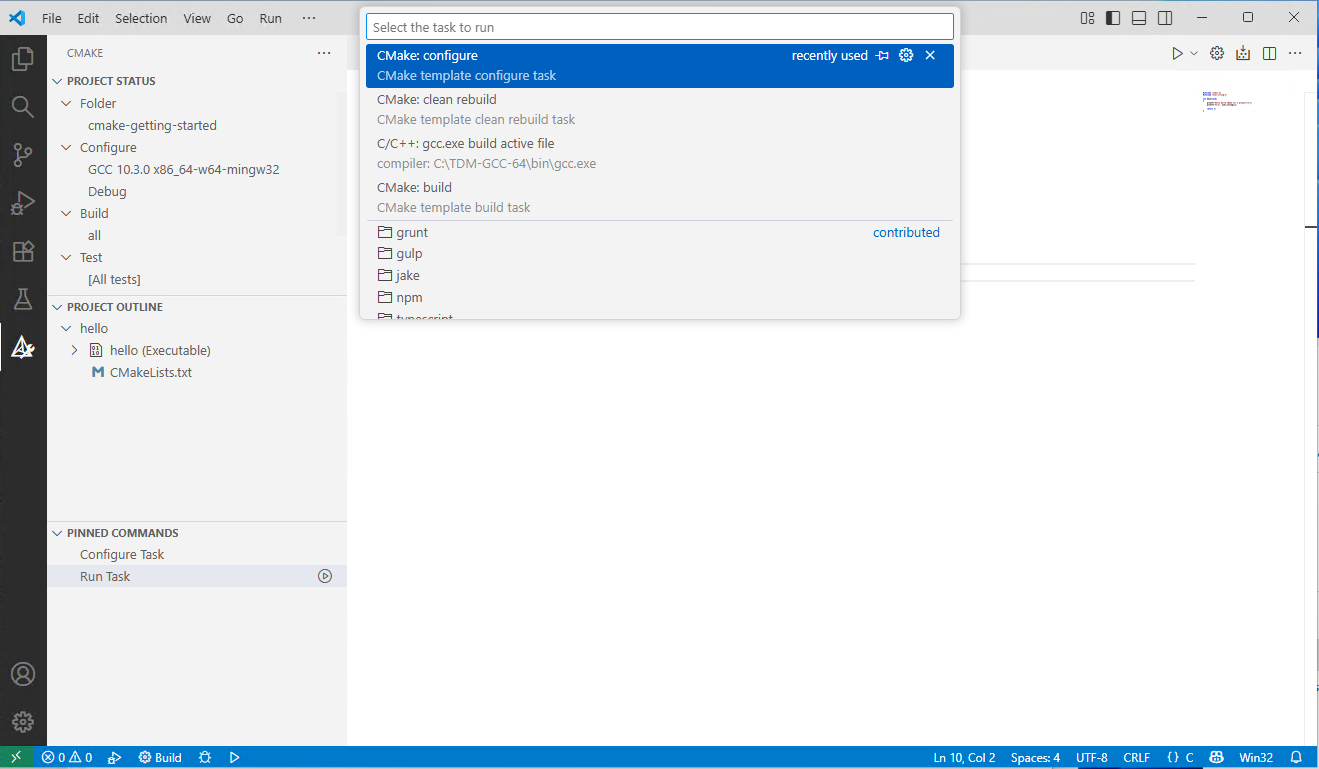
if you get any error messages, you might need to manually delete the contents of the build folder in the project. A successful CMake configure for this project looks like this
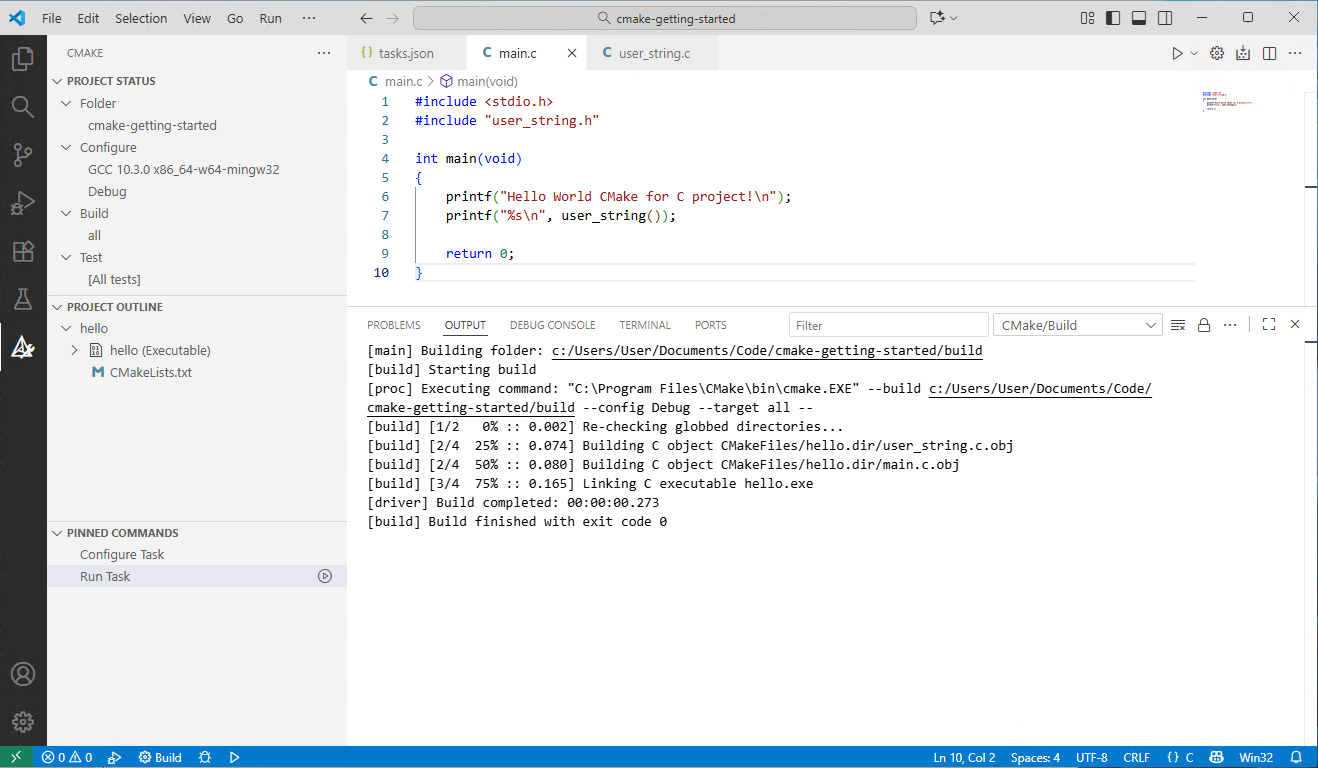
Click ⚙️Build icon in VS Code status bar
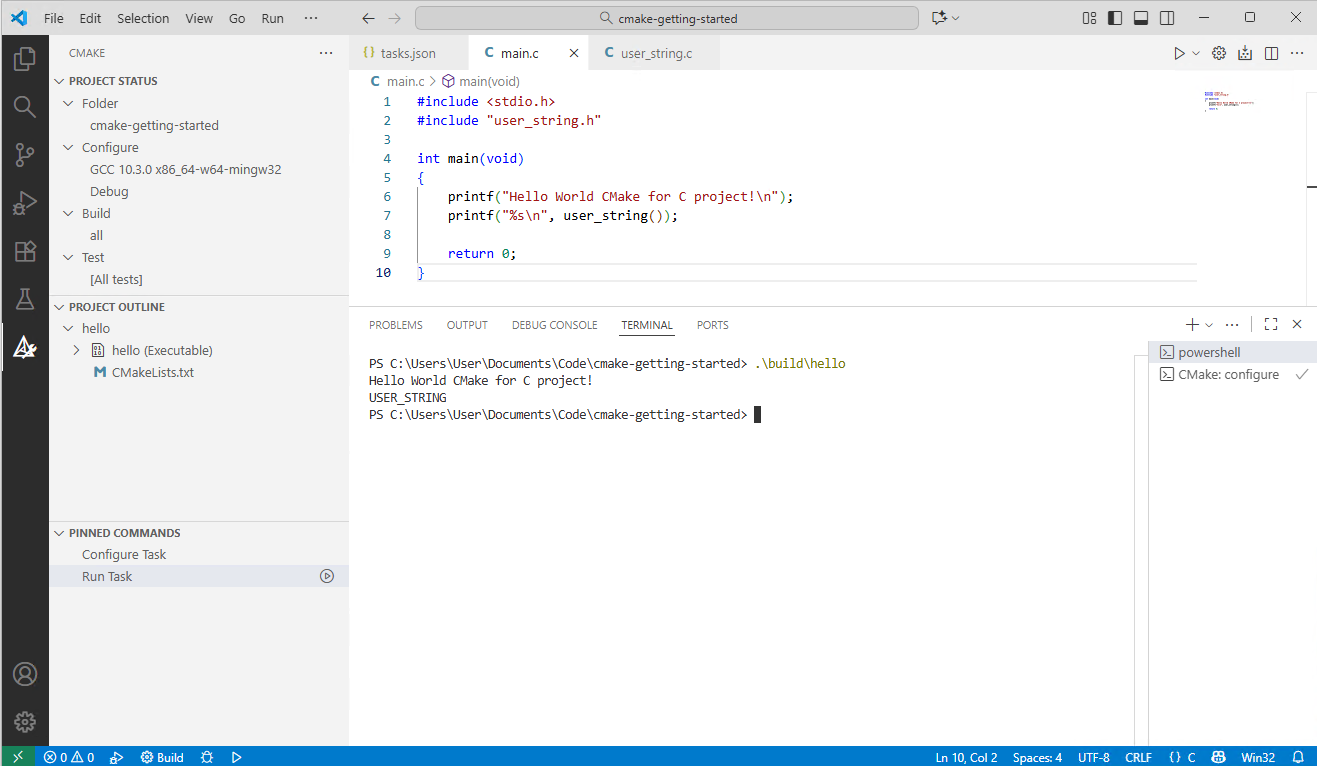
to run the exe in the powershell terminal inside VS Code, use the syntax .\build\hello
You can also run it in a command prompt: right click on the build folder in VS Code, Reveal in File Explorer, double click on build folder, type cmd into address bar, type hello into cmd window. The ability to run the exe outside the development environment might seem trivial but will be a crucial part of CI/CD.
But within VS Code, the easiest way is to click the ▶️run arrow in the status bar
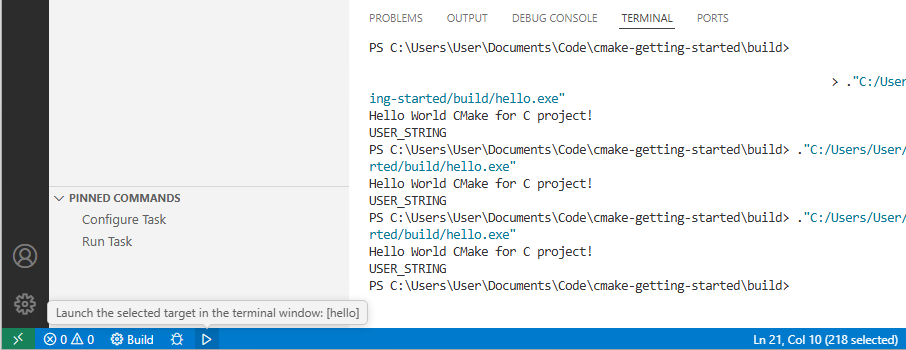
It's much faster to just click the ▶️run arrow in the status bar than Save files, Build, then run. The ▶️run arrow will do all this for you with one click.
Solving configure and build problems
If you're having configure or build problems that cannot be blamed on the source code, (e.g. because it hasn't changed since it last built, you have reason to trust it because of it's origin, or it builds ok with another tool, such as STM32CubeIDE), then it can be worth cleaning one or both of these folders given below. I haven't found CMake: clean or CMake: clean rebuild tasks that CMake Tools creates to be sufficient to resolve these errors.
Delete the contents of the \build folder in your project then rerun CMake: configure. CMake Tools sidebar - Pinned Commands - Run Task - CMake: configure
Delete the contents of the \CMakeFiles folder in your project before a configure.
Alternative way of accessing these commands using the Command Palette from the View menu
Ctrl-Shift-P - > CMake: Configure
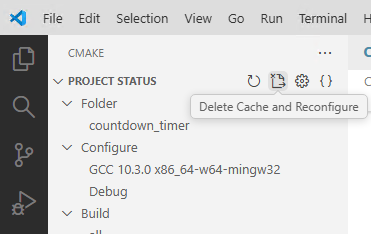
CMakeTools pane also has a Delete Cache and Reconfigure button
We've now got far enough to to debug in VS Code, which means the full power of the debug tools are available instead of having to be restricted by the embedded processor's limits and speeds.
Debugging with VS Code
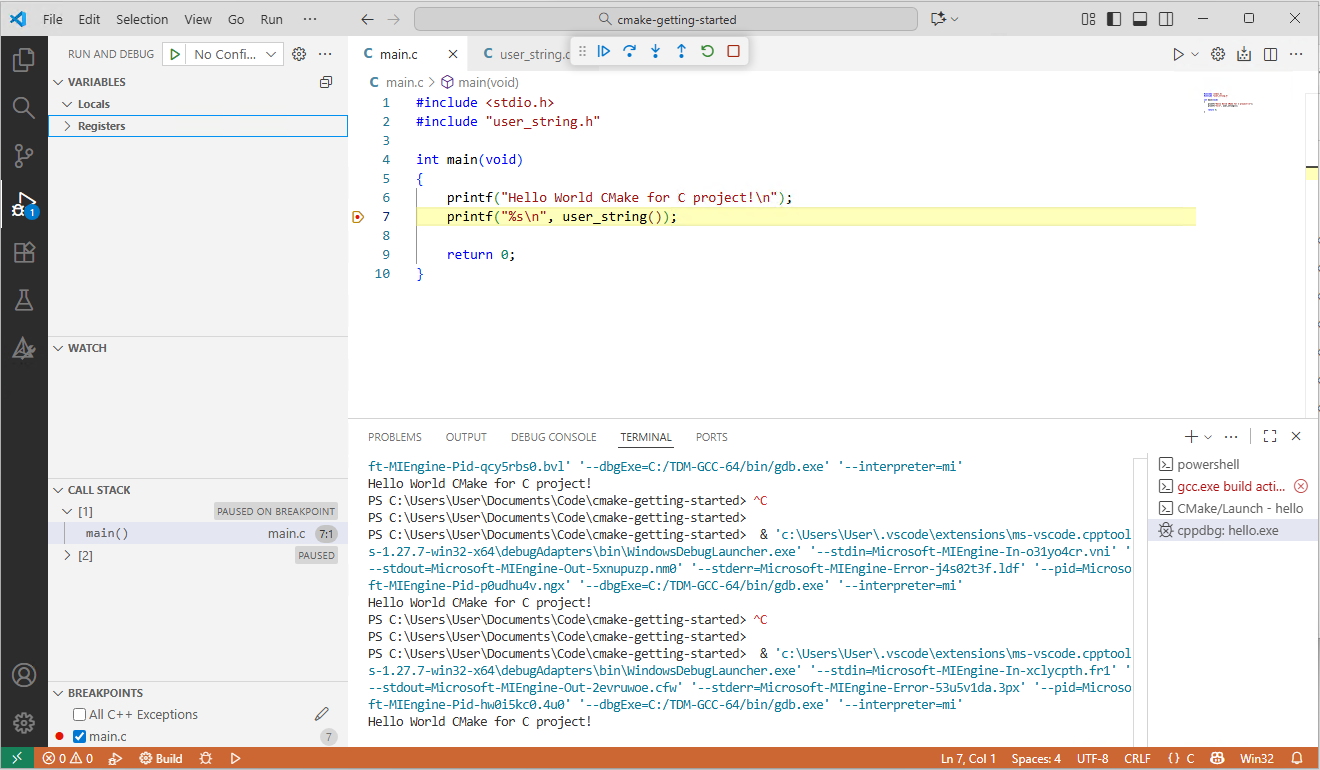
Set a code breakpoint by clicking in the left margin, left of the line numbers, say in your main() on a suitable line of code. Breakpoints are shown with red dots.
The left bar of VS Code has a Run and Debug tab with a Run and Debug button which is for debugging a single file and isn't likely to be suitable for your embedded project with multiple files. Instead, use the bug icon in the status bar to debug the project. However, the tab is useful for managing breakpoints - toggling off and on, adding new ones, clearing as well as variable evaluation.
You should see the project build and then go into debug mode, run and hit the breakpoint. Controls appear above the code pane with stopping and restarting, the current line is highlighted, variable values can be seen in the left panel etc. Step over (F10) or Run (F5) until main returns.
Now we have an Edit-Build-Run-Debug cycle which is very fast because it runs on your Windows machine and is more portable around the office and transferable between machines because it doesn't need your embedded board. This is a major productivity enhancement over working with an embedded IDE, programmer and target hardware. Another perk is the ability to develop remotely or in virtual machines.
WinLibs alternative to TDM-GCC
After this series of posts was completed, I found WinLibs which could be a superior alternative to TDM-GCC since it is available with a more up to date version of GCC (15.2.0 compared to 10.3.0) and in a 32-bit variant which would be better for compatibility with 32-bit ARM processors sizeof(intptr_t) == 4. But it is a much bigger download at 251 MB compared to 78 MB for TDM.
However, since the range of GCC versions is wider you might want to either match your embedded IDE's GCC version or use the latest available depending on your requirements.